
Few things tickle my fancy like a baseball player up to no good. Blue Jays reliever Brendon Little presently holds this distinction. Take a gander:
That’s Ramón Laureano swinging at Little’s knuckle-curve, which Little bounced off the front edge of home plate. Here’s another (pardon Matt Olson’s cameo):
That’s Sean Murphy quickly resigning himself to failure against another curve in the dirt, this one picked by Alejandro Kirk. One more for the ride home:
That’s Junior Caminero emulating a mangled corkscrew against yet another bouncing curve, something for which Little should consider getting a patent.
As Ryley Delaney noted at Blue Jays Nation a couple of weeks ago, the pitch is a superlative offering. It generated 30 whiffs in May, tied for most by any pitch thrown by a reliever. It has allowed the lowest contact rate on the season (min. 200 thrown), fueling Little’s ascent up the swinging strike leaderboard, where he stands tall with the majors’ fourth-highest swinging strike rate (min. 20 innings). The pitch also boasts both the lowest zone rate (Zone%) and highest rate of waste of any individual offering. Lastly — and I have to say I love this about him and for him — Little throws the pitch 83% of the time in two-strike counts. Eighty-three percent. Five times out of six! (All stats are as of June 8.)
Opposing hitters should know what they’re getting from Little when they’re down two strikes. It’s going to be a knuckle-curve, because the pitch is stupid good, if not haunted. It’s not going to be in the strike zone, because it doesn’t have to be. The hitter will swing anyway, often in the form of a noncommittal oooooops swing, because there’s two strikes and of course he’s swinging. It is all scripted in advance; even if the book were out on Little, which it should be, it wouldn’t really matter. This, after all, is a man who knows it’s perfectly fine to use the same trusty hammer every time he’s presented with a nail. This is a man who need not heed game theory and its intricacies because he supersedes it. This is a man engaged in shenanigans. This is a man up to no good.
What about the pitch has made it so effective? I have long been a proponent of the idea that pitches do not need to be conventionally “good” to be successful. They can simply be unique, unfamiliar. Little’s knuckle-curve certainly falls under this latter classification. Its only reasonably close comp is Kyle Freeland’s curve — in terms of total induced vertical and horizontal movement, they’re quite similar — but Little throws his curve four ticks harder with 500 fewer revolutions per minute from a higher arm slot. The result is a pitch that looks much firmer out of hand, presumably strike zone-bound, only for the bottom to fall out, leaving the opposing hitter to reflect on all the decisions he made in his life that brought him to the absolutely ghastly hack he just took at a wobbly curve that didn’t reach home plate.
…
Statcast’s new bat tracking data are as exciting as they are plentiful. The most obvious use case for these new measurements is the better evaluation of hitters. But I was more immediately compelled by what these data can tell us about the player on the other side of the ball (i.e., the pitcher), and I wasn’t alone. While more obvious applications include providing better context for existing outcomes like exit velocity, launch angle, and spray angle, Stephen Sutton-Brown, keeper of and mastermind behind Baseball Prospectus’ StuffPro metrics and related pitch modeling efforts, quickly identified a very clever use of swing path tilt:
Swing tilt relative to a batter’s average tilt on middle-middle four-seams tells you where they expected a pitch to cross the plate ==> modeling expected plate location given relative swing tilt gives us a way to validate expected pitch probabilities
— Stephen Sutton-Brown (@srbrown70.bsky.social) 2025-05-21T02:00:34.952Z
Sutton-Brown’s sabermetric pursuits and achievements routinely clock in above my pay grade. I don’t know how to model expected pitch probabilities! But I was immediately struck by his ingenuity, specifically the premise of estimating the hitter’s expected pitch location based on the observed tilt of his swing. Taking it a step further, I think we can assume a hitter typically exhibits mechanical continuity from pitch to pitch. As such, his swing path should feature consistent tilt at any given pitch location. This assumption allows us to use swing path tilt against any pitch to “reverse-engineer” the hitter’s expectation of the pitch’s location. Compute the difference between the expected and actual locations, and you’re left with what I’ll call the implied miss distance, or IMD.
It’s an imperfect theory. For one thing, the assumption that hitters are mechanically consistent from swing to swing is probably mostly correct, but not always. Not all swings are good swings (as evidenced above), and even some of the good swings are different from the other good swings. For now, this assumption is what it is. These inconsistencies affect every hitter, so at least the inconsistencies are consistent.
And let’s consider a still image of a swing where the bat is shown flush with home plate, having either just connected with or swung past a pitch. If you draw a line from the knob out through the head of the bat like a lightsaber, the swing path tilt intersects an array of locations with highly varied vertical and horizontal coordinates. Let’s use Bryce Harper as an example:
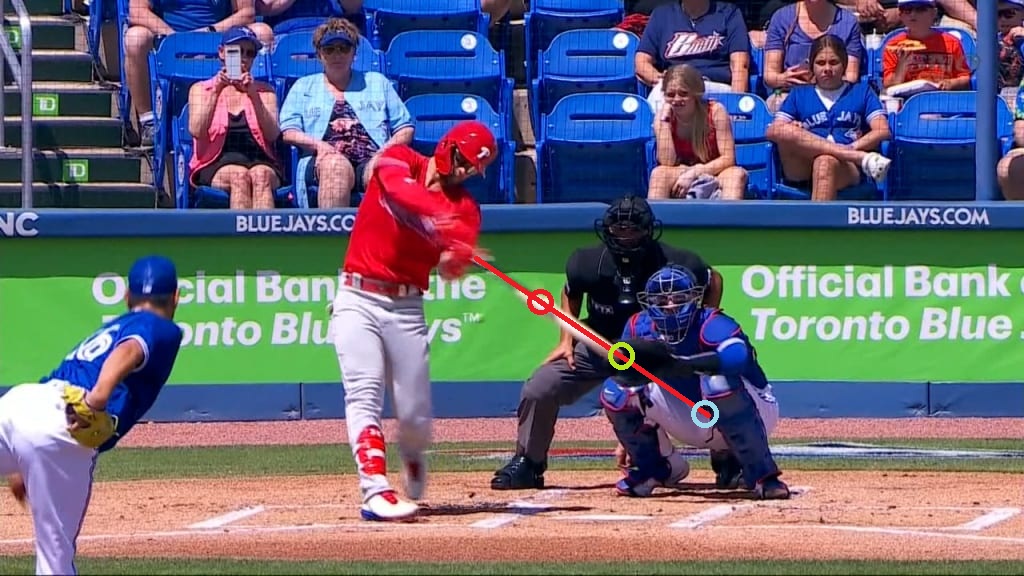
The red, green, and blue circles would all be valid pitch locations based on Harper’s swing path tilt. I’m not competent enough to determine, statistically, whether Harper expected that pitch to be up on his hands or down and away, both of which lie along the swing path tilt conveyed by his lightsaber. To circumvent this, I calculated a hitter’s average swing path tilt based exclusively on pitch height. IMD then becomes an estimation, with considerable error bars, of the average implied miss distance along the vertical plane (i.e., with respect to a pitch’s height). By reducing this issue from two dimensions to one, we simplify the question: “How far over or under the pitch did the hitter swing?”
Which brings us to the real reason we’re gathered here today: Little’s knuckle-curve, in addition to all its other honors and recognitions, boasts the largest average IMD (in absolute terms) of any pitch thrown at least 200 times this year. It’s the only pitch with an implied miss distance greater than eight inches on average, let alone nine. And this is not just on whiffs! Hitters miss his knuckle-curve by an average of three-quarters of a foot on every swing. They just swing right over the top of that sucker:
2025 Implied Miss Distance Leaders/Laggards
Data current as of June 1
Min. 200 pitches thrown
(Two other quick things. First, this is not a Kodai Senga post, but Senga having three pitches featured here — two leaders and one laggard — is fascinating. Also, because IMD is predicated upon vertical movement, we can see its bias toward pitches with vertical movement traits compared to those with lateral movement traits. Whiffs do tend to favor vertical movement, however, so this bias is not unfounded. Anyway.)
The magnitude and direction of a pitch’s IMD can tell us a lot about its effectiveness. For example, pitches with larger positive IMDs (meaning misses over the top of the pitch) induce shallower launch angles and more groundballs, while pitches with larger negative IMDs (under the pitch) induce steeper launch angles and more popups. (“Launch angle influence” below controls for pitch height and opposing hitters’ individual tendencies.) The line doesn’t pass perfectly through the origin, but it’s pretty close, and it may be gently affected by survivorship bias:

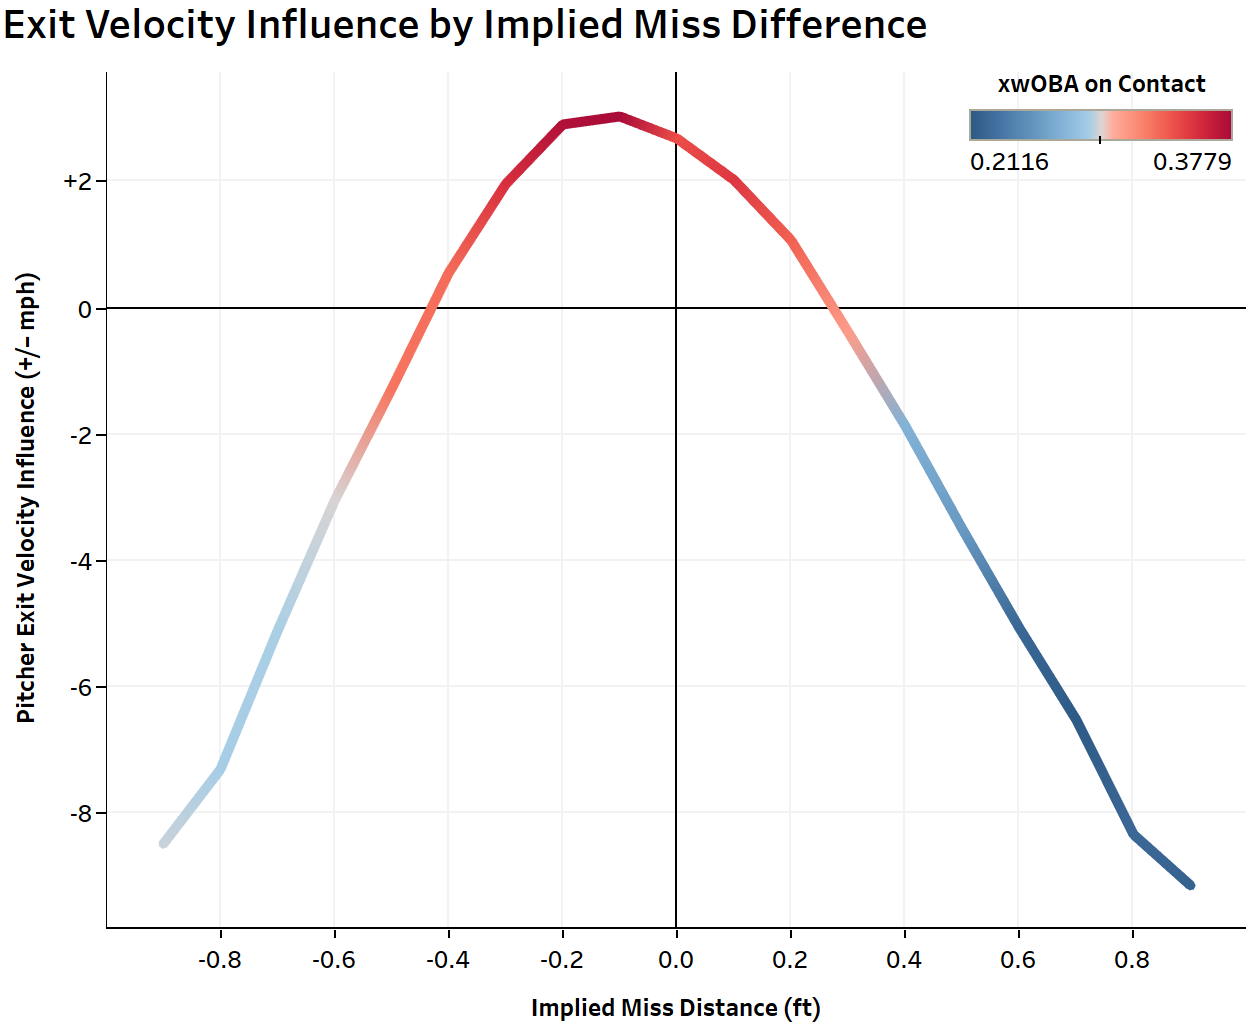
The absolute magnitude of the IMD also correlates with lower exit velocities. (“Exit velocity influence” controls for pitch velocity and opposing hitters’ individual tendencies.) It is convenient to my theory and my fragile ego that, like launch angle influence above, hitters indeed maximize their exit velocities against pitches where the implied miss distance is effectively zero…
…because if the IMD is zero, the hitter has more likely than not squared up that pitch:
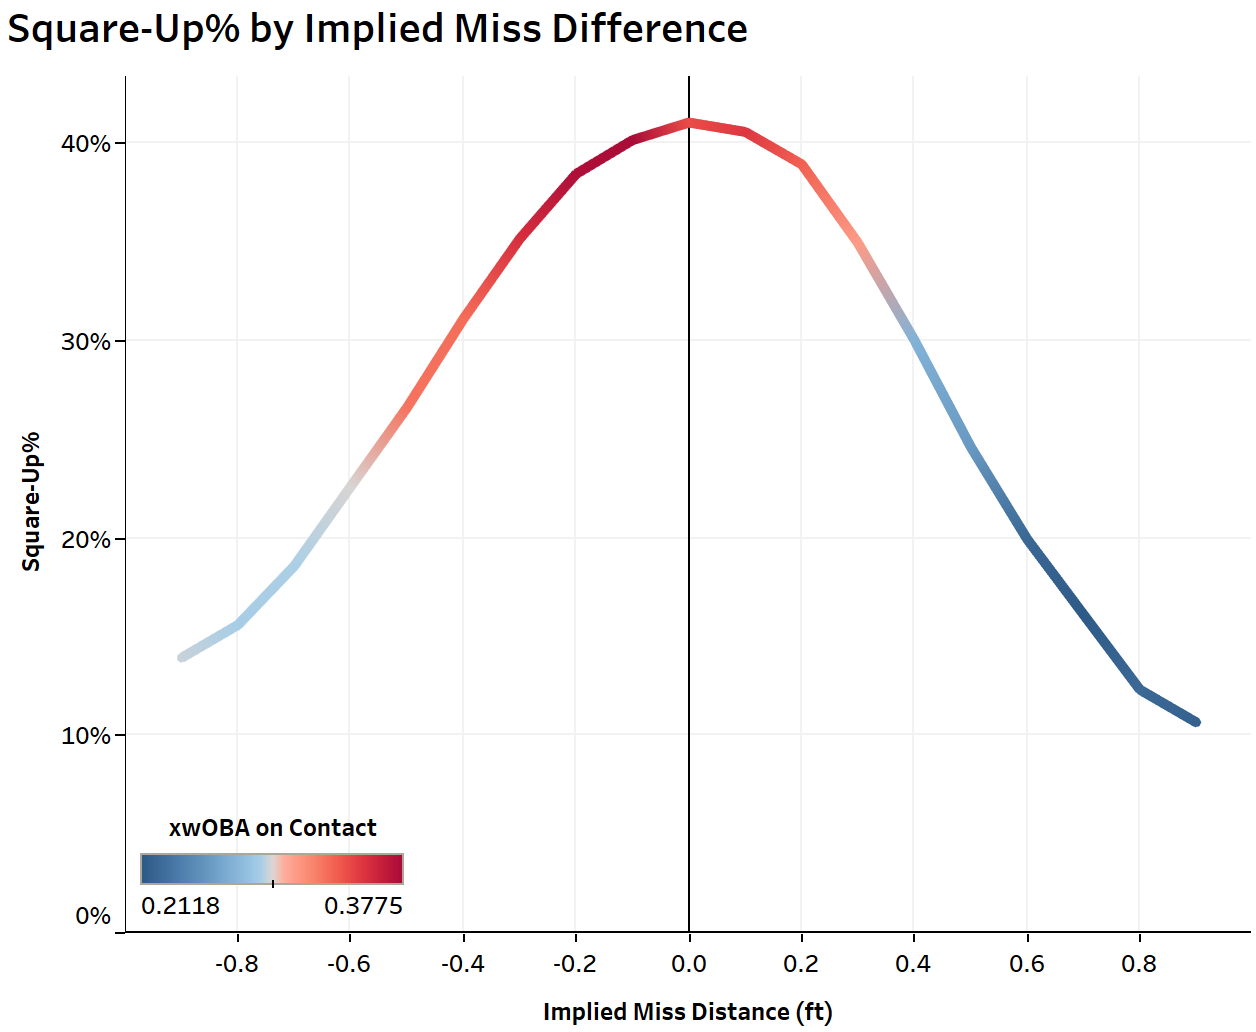
From the color-coding in each graph, you can see from pretty much every vantage point how expected contact quality (vis-à-vis weighted on-base average on contact, a.k.a. xwOBAcon) is maximized where IMD is minimized, and how pitchers’ abilities to exert their influence over outputs — by suppressing exit velocities, by skewing launch angles, by preventing flush contact — can be externally validated. Little’s knuckle-curve numbers: -2.1 mph exit velocity influence, -10.4 degrees launch angle influence, 13.3% squared-up% (league average is 31%), .171 xwOBAcon (compared to .347 actual wOBAcon). It all tracks.
Thus, I see IMD almost as a measure of a pitch’s swing (and miss) quality. It not only helps corroborate something like swinging strike rate but also lends veracity to a pitcher’s contact management skills and the degree to which they manifest. Pitch location by itself already goes a long way toward explaining those; pairing location with IMD adds even more clarity. IMD likely needs further stress-testing — for example, swing path tilt does not increase linearly with pitch height, so IMD may be overstated for pitches with low targets (like changeups or Little’s knuckle-curve) compared to pitches with high targets, like four-seamers — but this rudimentary version seems sufficiently illuminating to me.
At the end of the day, IMD is just a descriptive metric. It tells us what happens (or at least gives us its own version of the story about what happened), and it may have some predictive value to it, but it does not explain why Little’s knuckle-curve is so good, why it elicits such woeful swings, just that it does. That, I think, is a job for Sutton-Brown and like-minded nerds (complimentary) whose work already relentlessly pursues these answers through capital-‘s’ Stuff modeling, arsenal interaction effects through shape mimicry, tunneling, and sequencing, and so on. These topics can invariably provide an explanation for Little’s dominance. (Speaking of which, Stuff+ loves the pitch in question.)
Still, as far as descriptive metrics go, this one seems pretty nifty, especially if it validates my Little king, for whom I’ve quickly developed a great fondness. Little’s knuckle-curve makes hitters look like absolute buffoons, and IMD confirms this. (The clips at the beginning of this post? I chose them by looking up the three biggest IMDs elicited by Little’s knuckle-curve. They did not disappoint.) He spams the pitch relentlessly in two-strike counts; that it’s almost never located competitively by the time it reaches home plate adds insult to injury. He can’t keep getting away with it. IMD suggests he probably will.
Content Source: blogs.fangraphs.com