
We’re 10 years or so into the launch angle revolution, and the reasoning behind it hasn’t changed much. Groundballs have a .228 wOBA this season, while all other balls in play are at .462. Hit the ball on the ground, and you’re Christian Vázquez. Hit it in the air, and you’re Aaron Judge. Players are gearing their swings for damage in the air. They’re optimizing their bat path for an upward trajectory. They’re meeting the ball farther out in front. They’re looking to hit the bottom third of the ball. Knowing all this, I doubt you’d be surprised to learn that 2025 is shaping up to set the record for lowest groundball rate since 2002, when Sports Info Solutions first started tracking such things. But you might be surprised to learn just how extreme the shift has been.
So far, I’ve talked about all the reasons that batters have tried to put the ball in the air more, but that’s only half the story. Five years ago, Ben Clemens wrote a great article in which he tried to determine whether batters or pitchers exert more control over groundball rates. After separating the batters from the pitchers, he split each group into quartiles based on their 2018 groundball rates and then looked at the results when each group faced off in 2019. He found that the effect was nearly identical. When you moved the batter up one quadrant, the groundball rate of the new pairing went up by an average of 5.2 percentage points. When the pairing moved up a quadrant in the pitcher pool, the groundball rate went up by 4.8 percentage points. Knowing that, let’s not blame this all on the batters. Are pitchers as responsible as batters for the shrinking groundball rate across the majors? Let’s start by updating my 2023 league-wide update on pitch mix.
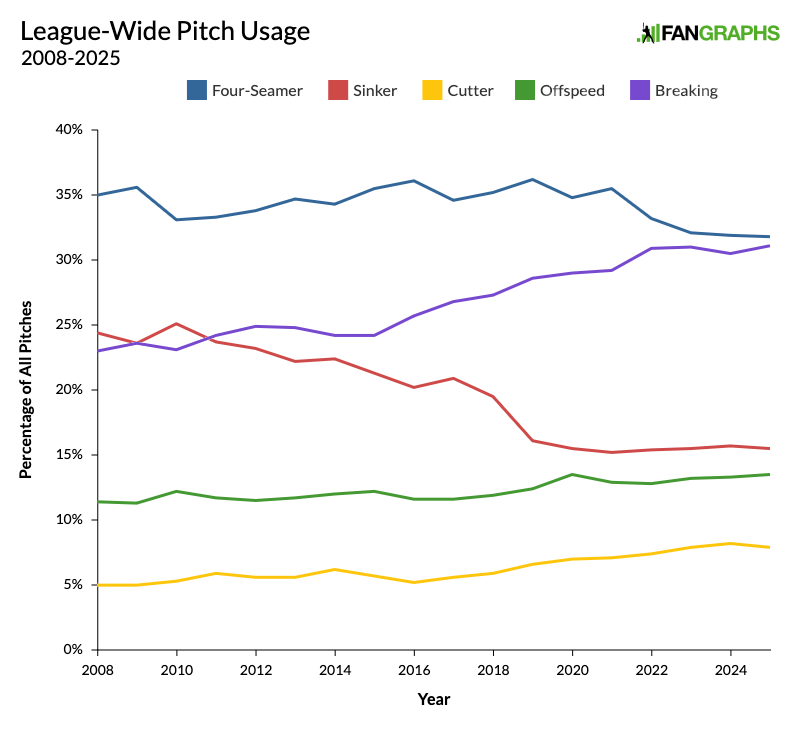
The biggest changes over the last 10 years have been the well-documented increase in breaking balls and the rise in four-seamers usurping sinker usage. However, those numbers have more or less stabilized in recent years. Most recently, though, we’ve seen upticks in the usage of cutters and offspeed pitches, hence all that business about the Year of the Cutter/Splitter/Kick Change. Offspeed pitches, which drop and fade to the pitcher’s arm side are usually thrown against opposite-handed batters. They trail only sinkers in terms of their ability to generate groundballs. If this graph were all we had to go on, we might expect a slight uptick in groundball rate this season, thanks to the rise of offspeed pitches, instead of the other way around. But, of course, this is not all we have to go on.
As you surely know, pitchers aren’t necessarily chasing groundballs. They’re much more concerned with chasing whiffs, and those two goals are sometimes at odds with one another. For example, pitch height has a real effect on batted ball type. Here’s how things have averaged out for four-seamers this year: Those that became grounders crossed the plate at a height of 2.61 feet, line drives at 2.67, fly balls at 2.76, and popups at 2.91. We’re only talking about a spread of four inches in total, but it paints a very clear picture. At the same time, four-seamers earn more whiffs at the top of the zone, so pitchers are throwing them higher and higher, and that means fewer groundballs. Here’s how all pitch heights have changed.
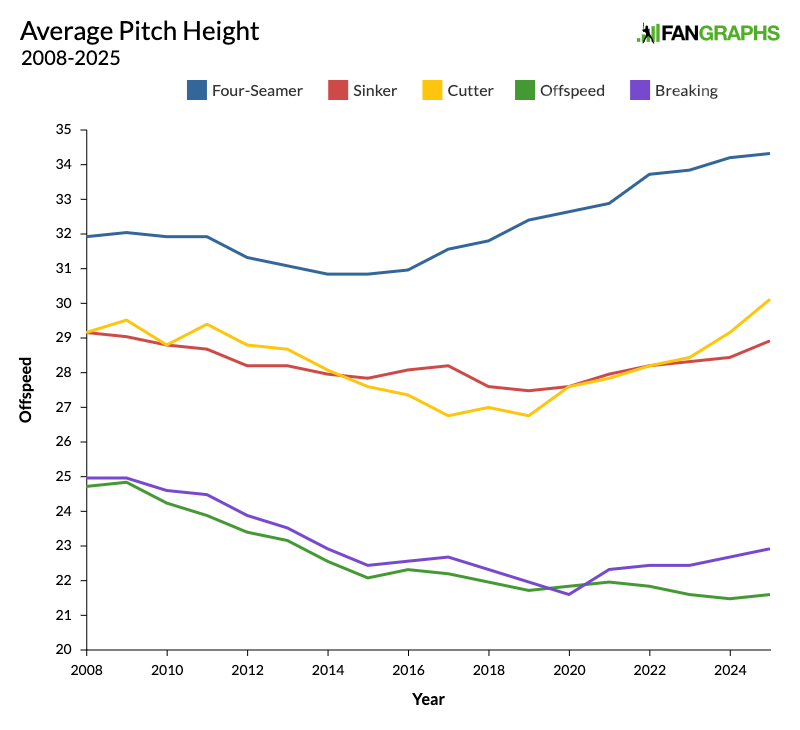
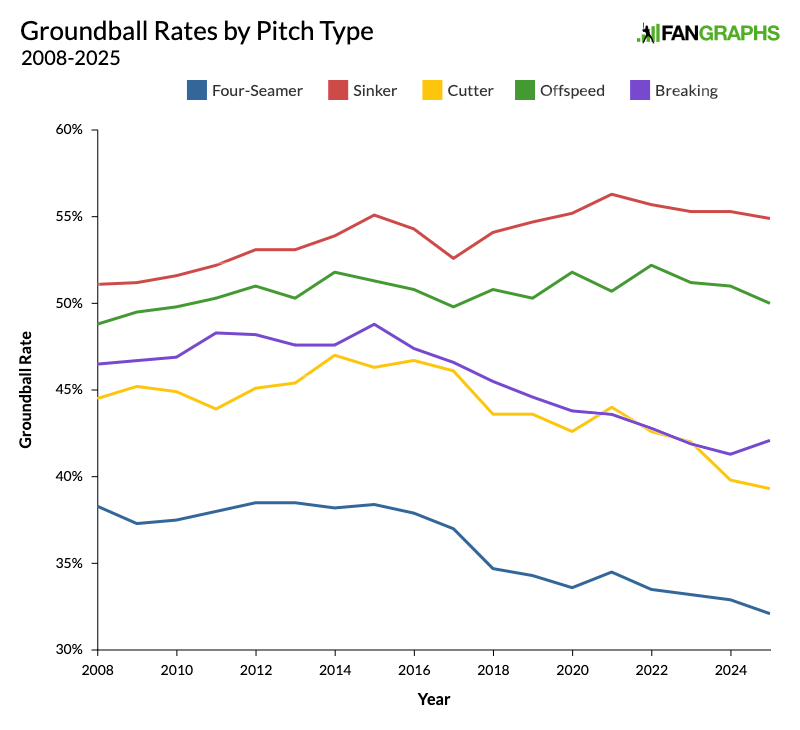
As expected, four-seamers are coming in ever higher, but over the course of this decade, every pitch type except for offspeed pitches has also been coming in higher. There are logical reasons for this. Pitchers are increasingly instructed to trust their stuff and let it rip, aiming for the center of the strike zone and letting the movement take it to the edge. The rise of the sweeper and the bullet slider means that the average slider has less drop than it used to. The high sinker is no longer just a mistake pitch. Pitch height definitely isn’t the only reason for the drop-off in grounders, but every single pitch type has seen its groundball rate decline from 2021 to 2025.
Put all this together, and we’ve got a recipe for a huge shift in overall batted ball composition. So far this season, the A’s pitching staff has a 36.8% groundball rate according to Sports Info Solutions, which has been tracking these things since 2002. That’s the lowest groundball rate SIS has ever recorded. Second place belongs to the 2025 Blue Jays, and fourth and 10th place also belong to 2025 teams. That’s four teams from the current season in the top 10. On the hitting side, two teams from this season, the Tigers and the Cubs, rank in the top 10. According to Baseball Savant, this will be the fourth year in a row and the eighth year in 10 with a record-low groundball rate. I’ve been saving this for the very end, so take a look at this graph and get ready to do your best Sarah Langs impression.
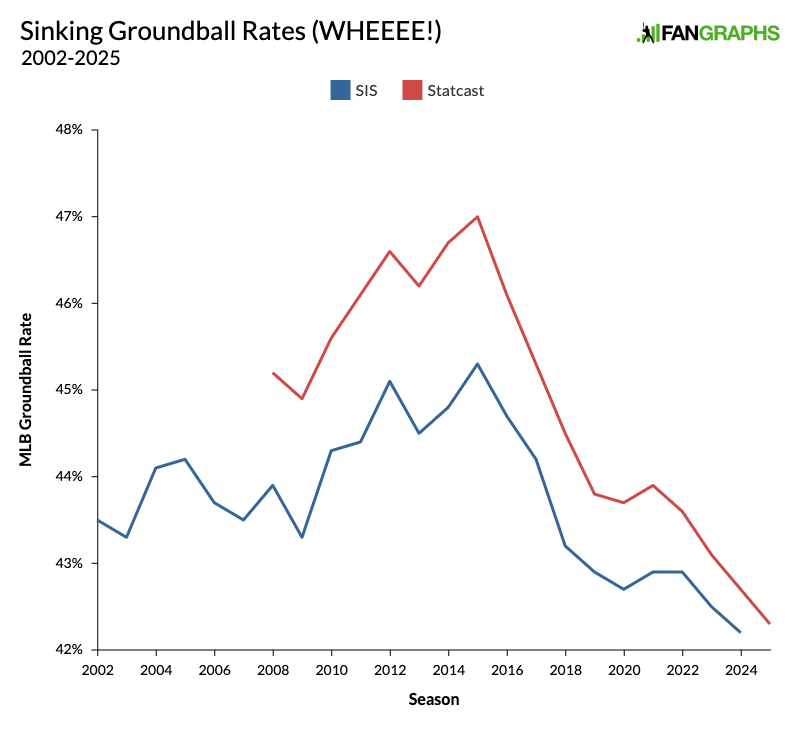
Everything we’ve covered so far is intuitive enough, but when you combine it all, you get an awfully sharp decline. According to Statcast, from 2015 to 2025, the league-wide groundball rate has dropped from 47% to 42.3%. In other words, 10% of all groundballs have and turned into air balls. Batters and pitchers are both contributing to it in their own way, but it’s a big shift, and as long as the current trends hold, the only mitigating factor in sight is the very slight increase in offspeed pitches in recent years. The struggle between pitchers and hitters is always evolving, with adjustments and counter-adjustments percolating throughout the league. Batters steepen their swings, so pitchers attack them with high fastballs, so batters start swinging above where they expect high pitches to come in, so pitchers start throwing high sinkers, and so on. The thing is, all of those adjustments have tilted toward more air balls and fewer groundballs. We’ll have to wait and see what the next adjustment brings, but at the moment, it sure looks like groundball rates will only continue to fall.
Content Source: blogs.fangraphs.com