
Every July, FanGraphs releases our annual Trade Value Series highlighting the top 50 players in baseball, taking contract status and performance into account. For the past four years, I’ve been in charge of this exercise, with liberal amounts of help from the rest of the FanGraphs staff and some contacts on the team side. This year, I’ve got company. For the first time, FanGraphs readers will be creating their own trade value list.
I’m proud to announce the debut of our crowdsourced trade value tool, available here. The tool, created by Keaton Arneson, and developed by Keaton and Sean Dolinar, aggregates simple “Which of these two players do you prefer?” questions to create a composite ranking. Using the tool is simple. When you pull it up, you’ll be presented with two players and asked to choose which one you think has a higher value in trade:
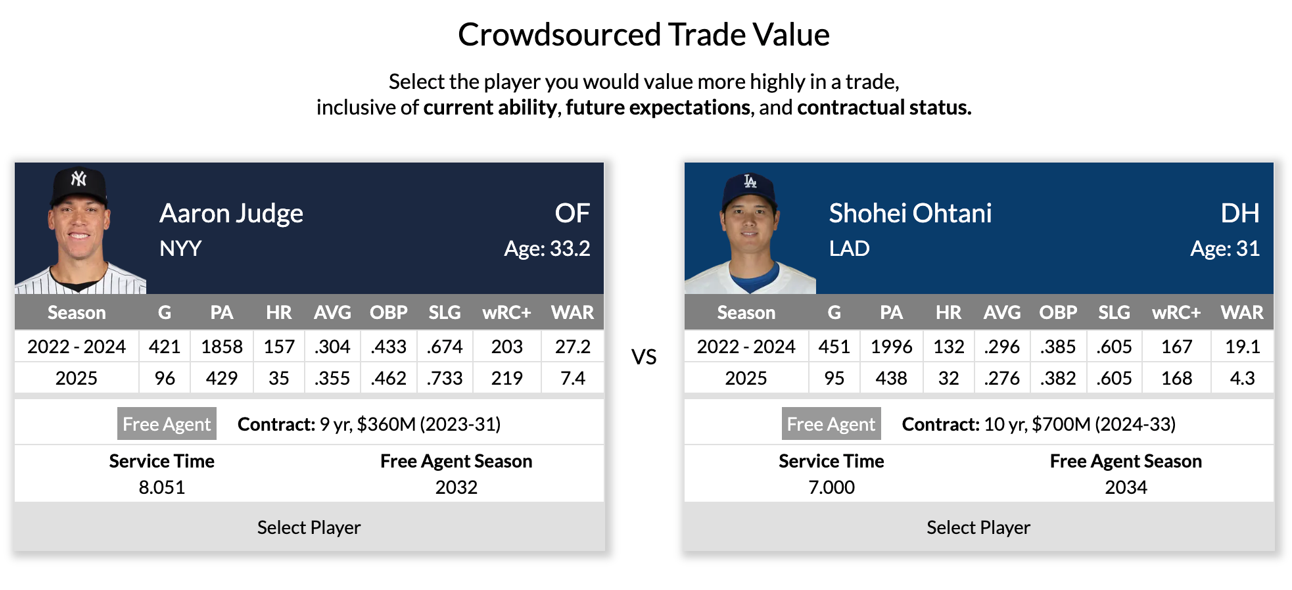
Ah, but what does “higher value” mean? Sometimes the simplest questions are the toughest. Having a higher value in trade isn’t the same as being better, or being younger, or having a more team-friendly contract. It might be some combination of those things, of course, and of other factors as well. In the real world, players have differing levels of value to teams based on a host of considerations, from how well they plug a hole left by a recently injured star to where the team finds itself in the playoff race. A promising prospect might mean more to a rebuilding club, just as a proven difference maker might move the needle for a team with October ambitions. We can’t tell you how to weigh these factors, which is part of the fun in constructing a trade value list in the first place. What we can do is provide some data that we consider useful in making determinations and let you decide how to apply it.
To that end, we’ve included biographical and statistical data for the players you’ll be choosing between. For each player you’re asked to make a decision about, you’ll see their current age, aggregate statistics for the 2022-24 seasons, statistics for the 2025 season, and contractual details. For players who hadn’t debuted before 2025, we’ve also included data from The Board: prospect ranking, ETA, individual tool grades, and their Future Value grade.
Your instructions, in each case, are deceptively simple: Just pick the player who you think has more trade value. What that means is entirely up to you; we say plenty about how players ought to be valued relative to each other during trade deadline season. There’s no formula for choosing, no mathematical certainty. If there were, this exercise wouldn’t be particularly interesting. This is more art than science, but as we’ve found with our contract crowdsourcing, we suspect there’s some wisdom to be drawn from the crowd here. Pick a winner, and you’ll get another matchup. You can do this as many (or as few) times as you’d like. (Here I’ll also note that you can’t reset or undo a pick.) The more choices you make, the more our system will learn the preferences of the FanGraphs readership. And yes, that does mean you need to be logged in to use the tool; that’s how we work up each voter’s preferences individually.
As you make more selections, you’ll notice two things. First, we provide a list of your personal top 10. This is based only on your own selections, ignoring the rest of the readership. Second, you’ll notice that matchups aren’t selected entirely randomly; you’ll frequently see players who you have never chosen against, matchups between players we think you rate similarly, and matchups we need more of in our database. We’ve found that 150-200 matchups is a good cutoff to create a reasonable personal top 10, but you should feel free to do however many you’d prefer.
Behind the scenes, we’re transforming your A-or-B selections into rankings using a modified form of the Elo rating system. At its core, Elo works by predicting the winner of a matchup based on the two competitors’ current ratings. After the matchup, Elo adjusts the ratings based on what actually happened. The winner gains points while the loser loses an equal number of them. The key is that the number of points exchanged depends entirely on how surprising the result was. The more expected a result, the fewer points change hands. In other words, the tougher the opponent, the more points you get for beating them, and the more points they forfeit for losing. The opposite is true, too: The easier the opposition, the less a win improves your rating.
Using teams instead of players as an example, Elo wouldn’t change its estimation of the Dodgers and Rockies by much if the Dodgers won a game between the two squads. However, if the Rockies pulled off the upset, Elo would adjust their ratings by a much larger amount. How much larger? The change is proportional to the upset’s probability. In a matchup with an expected 80%/20% split, the favored winner (the 80% outcome) only gets a small reward should they prevail. But if the underdog wins (the 20% outcome), they get a reward four times as large.
One of Elo’s distinguishing features – or bugs, depending on what you’re using it for – is that it’s path dependent. Matchups that occur earlier inform the odds for later matchups, which means that the ordering of the matchups matters. Consider a simple example: You pick twice between Gunnar Henderson and Bobby Witt Jr., who ranked first and second on last year’s Trade Value list, selecting each one once. If you select Henderson as the winner first, with no prior information, the engine treats it as an even matchup and awards him some points. Then, when you pick Witt the second time, Elo sees this as an upset – after all, Henderson was ranked higher than Witt thanks to your first choice. Elo awards Witt more points than he lost in the first round, and docks Henderson by the same amount. Now Witt is ahead of Henderson in your rankings, but if you’d instead picked Witt to win the first matchup and Henderson to win the second, the reverse would be true.
That might be useful for evaluating team strength – we care a lot more about games that happened yesterday than games that happened in April or even in 2024 – but for this exercise, the concept of “earlier” doesn’t make much sense. To remove this path dependency, we algorithmically select the order of the matchups completely randomly and calculate Elo ratings based on that. Then we repeat the process 100 times, picking a random order each time, which gives us 100 different sets of ratings. We then average the ratings to produce a path-agnostic final order.
Worried that someone will stuff the ballot box? Fear not. Once all the matchups have been submitted, we’ll perform checks to ensure we didn’t get spam, and, if necessary, apply weighting to balance the feedback of those who submitted a lot of matchups versus those who only submitted a few. In this way, we believe we’ll get a good measure of the views of the FanGraphs audience as a whole.
So please, help us out! Hop over to the tool and start picking. The tool is live now, and will be available for use through next Friday and the conclusion of the Trade Value Series. After that, we’ll release the crowd’s aggregate list and dive into some of the most interesting matchups. Happy clicking – and remember, whatever you think “higher value” means, use that as your criteria.
Content Source: blogs.fangraphs.com