
Last week, I dug into the data a little to see if there was any empirical basis to the suspicion that the Brewers lineup might not be cut out for October. The result was a new metric, if you want to call it that, called MeatWaste%. This number — the percentage of pitches that end up either in the dead center of the strike zone or out in Baseball Savant’s Waste region — I used as a proxy for pitcher quality. MeatWaste pitches are gifts to the batter, the kind of offering that produces an instant swing decision and either an easy take or a full-force swing.
I found two things: First, that the Brewers are better, relative to the league, on these two pitch locations than they are on the whole. And second, that these easy opportunities come around often in the regular season, but disappear in close playoff games. Simple enough, though there are limits to what this finding allows us to infer about the Brewers’ future. It’s why they play the games, after all.
This article seemed to resonate with the readers for two reasons: First, MeatWaste reckons with the idea that regular season and playoff baseball are different. Being able to predict and quantify how has been the Holy Grail of sabermetrics for as long as I’ve been doing this. In short, it touches on a subject people like to talk about. Second, many readers found the name of this stat either funny and/or gross, and felt obliged to say so. To them, I say thank you. Branding is so important in this day and age.
Anyway, now that I’ve got this methodological framework, I thought I’d answer some more questions with it. I remember vividly someone replying to the post on Bluesky, asking if I could look at individual pitchers’ MeatWaste numbers. If that was you, step forward and claim your prize; I can’t find the post, leaving open the possibility that I hallucinated it out of sheer desire to keep saying MeatWaste.
Nevertheless, I went to Baseball Savant and pulled out every pitcher who has thrown at least 500 pitches through Tuesday’s games (453 in all), and every batter who’s faced the same number of pitches in that time (406 of those).
You’ll be interested to learn that 10 pitchers are running a MeatWaste% of 20 or higher.
The MeatWastiest Pitchers in Baseball
Source: Baseball Savant
min. 500 pitches through 9/16
And here are the 10 pitchers with the lowest MeatWaste% in baseball this season.
The Least MeatWastey Pitchers in Baseball
Source: Baseball Savant
min. 500 pitches through 9/16
Seems like pitchers at both extremes are suffering. Or at least Nola is; despite avoiding the worst locations better than any other pitcher in the league, the frustrating Phillies right-hander is currently rocking an ERA in the mid-6.00 range.
Mahle being second on the list is interesting, however, because not all pitchers suffer by throwing in the MeatWaste region. Garrett Crochet, for instance, has such overpowering stuff that he’s plus-11 runs on meatballs this season, tops in the league. No pitcher is profiting by throwing waste pitches, but Crochet is one of several — including Mahle — who come out ahead on MeatWaste pitches in total.
Despite (or perhaps because of) avoiding these zones of danger, Mahle is tied for fourth in context-neutral run value on MeatWaste pitches in total, and seventh in run value per 100 pitches. Mahle not only has a 2.34 ERA, he’s outperforming his FIP by a full run, while Nola is underperforming his FIP by a run and a half.
Here we find the limits of MeatWaste% as a predictive tool for pitcher evaluation. Because it appears to have absolutely zero correlation with a pitcher’s opponent wOBA or xwOBA.
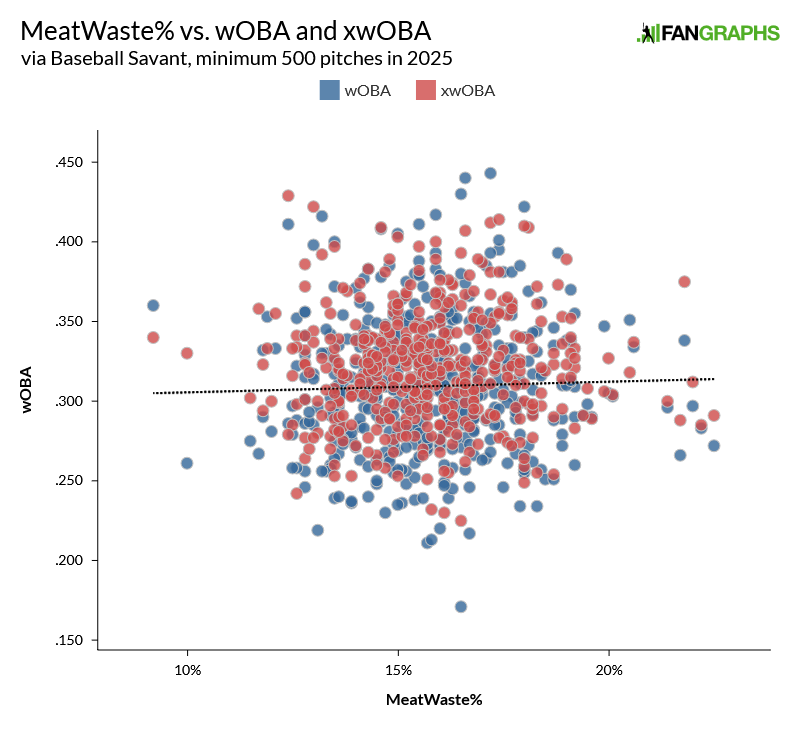
I’ll include the same graph for position players just for funsies.
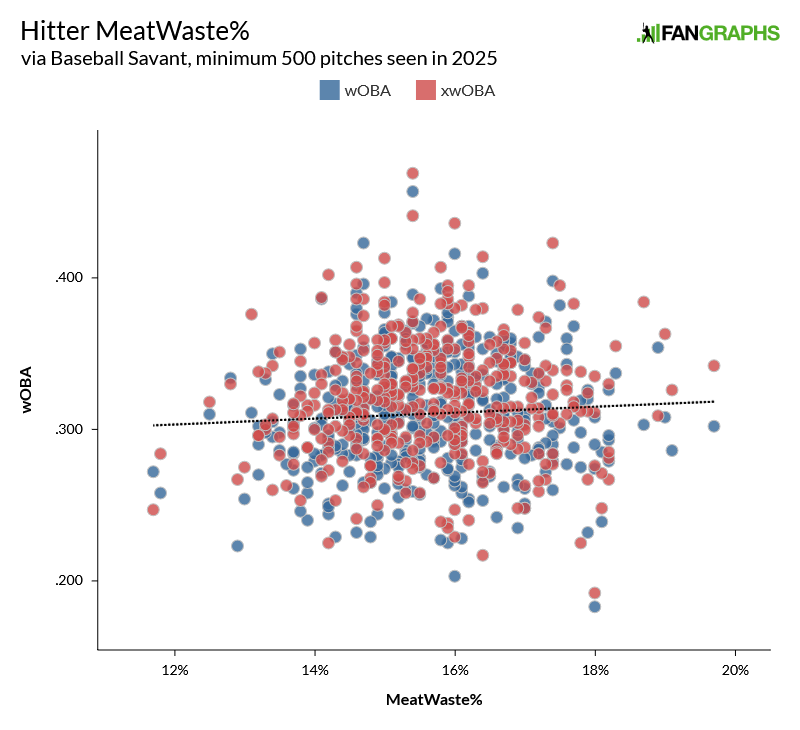
There’s no reason to expect a correlation between hitter quality and MeatWaste% for two reasons. First, the hitter doesn’t choose where the ball goes, the pitcher does. Second, MeatWaste balls are bad for the pitcher for contradictory reasons: Meatballs are easy to hit, while waste pitches are easy to take. You throw meatballs to hitters you’re not scared of, and you throw waste pitches to hitters you are scared of.
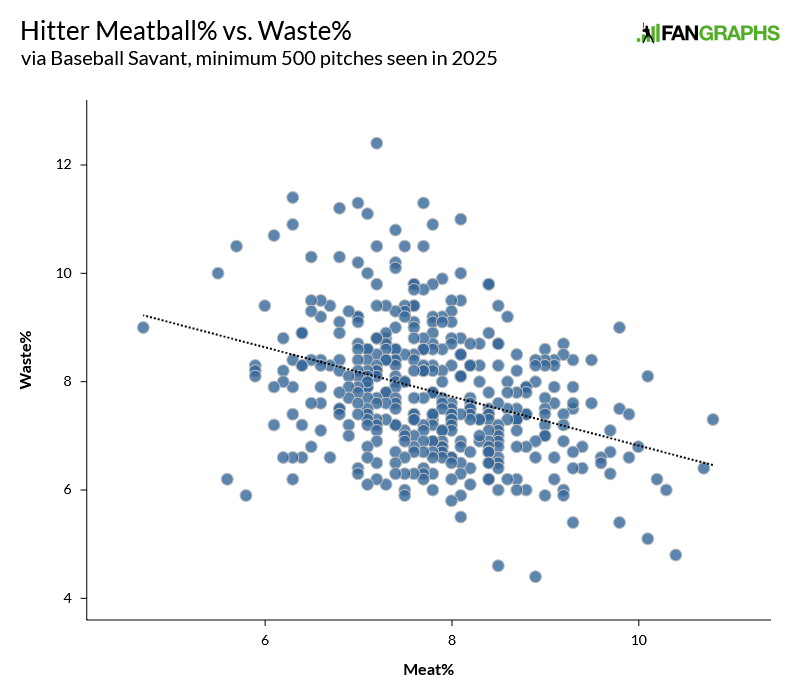
As you can see, when meatball percentage goes up, waste percentage goes down.
But there are two good reasons to investigate the MeatWastey characteristics of individual hitters. First: idle curiosity. Second: The original premise of this idea was based on the assumption that certain hitters are keyed in to punish mistakes, but might lack the ability to hit the best stuff from the best pitchers. Identifying hitters who dine out on MeatWaste is a good step toward testing the hypothesis that this has anything to do with a postseason “secret sauce.”
Take a look at this table of the hitters with the highest MeatWaste% in the league and tell me what you see.
The MeatWastiest Hitters in Baseball
Source: Baseball Savant
min. 500 pitches through 9/16
That’s right, this is a list of guys who will swing at anything. O’Neill’s walk rate this year is 9.1%; none of the other nine hitters has a walk rate higher than 6.0%. There are good hitters on this list, bad ones, average ones, guys with power and guys without power, but all of them are highly aggressive.
So it’s weird that opposing pitchers seem unconcerned with making those swing decisions easier. Or, consider that nine of the 30 highest waste percentages in the league are represented on this table, so maybe pitchers think these guys are so aggressive they’ll come out of their shoes swinging at four-seamers over their heads and sliders in the dirt.
The other end of the chart is mostly made up of poorer hitters.
The Least MeatWastey Hitters in Baseball
Source: Baseball Savant
min. 500 pitches through 9/16
Again, a low waste rate indicates that hitters just aren’t scared of these guys. Don’t worry, Adley Rutschman, I’m sure you’ll turn things around.
Figuring out who the biggest MeatWaste merchant in the league is presents some challenges. The hitter who’s produced the most MeatWaste runs in the league this year is Aaron Judge, with 30. Judge, as it happens, is second in the league in non-MeatWaste runs produced, with 39, trailing only Shohei Ohtani.
And it’s the same for the other leaders in MeatWaste runs: The next three on the list are Byron Buxton, Kyle Schwarber, and Cal Raleigh. Juan Soto and Corbin Carroll are in the top 10 as well. The great MeatWaste hitters are great all around.
The method I settled on was to find each hitter’s run value per 100 pitches, according to Baseball Savant, for both MeatWaste and non-MeatWaste pitches, and then to subtract the latter from the former. I was going to say everyone hits better against MeatWaste pitchers than non-MeatWaste pitches, but that’s not strictly true; 30 hitters posted a lower run value per 100 pitches against non-MeatWaste offerings. But 30 out of more than 400 isn’t that many.
For this leaderboard, I raised the playing time threshold to 1,000 pitches, as having a 500-pitch minimum for a per-100 pitch stat invited some flukiness.
The Hitters Who Benefit Most From MeatWaste
| Player | Total Pitches | wOBA | MeatWaste% | MWRV/100 | non-MWRV/100 | Difference |
|---|---|---|---|---|---|---|
| Byron Buxton | 1,854 | .371 | 17.3% | 9.06 | 0.07 | 9.00 |
| Jake Burger | 1,258 | .305 | 17.4% | 6.39 | -1.73 | 8.13 |
| Colton Cowser | 1,344 | .285 | 13.7% | 5.98 | -1.55 | 7.53 |
| Hunter Goodman | 1,975 | .360 | 16.8% | 7.55 | 0.06 | 7.49 |
| Royce Lewis | 1,399 | .293 | 14.2% | 6.03 | -1.08 | 7.11 |
| Tyler Soderstrom | 2,087 | .356 | 15.3% | 6.58 | -0.23 | 6.81 |
| Christian Walker | 2,389 | .306 | 15.0% | 5.57 | -1.08 | 6.65 |
| Agustín Ramírez | 1,940 | .302 | 16.5% | 5.31 | -1.30 | 6.61 |
| Kerry Carpenter | 1,624 | .347 | 15.4% | 6.80 | 0.22 | 6.58 |
| Giancarlo Stanton | 1,065 | .384 | 15.1% | 6.83 | 0.33 | 6.50 |
Source: Baseball Savant
min. 1,000 pitches through 9/16
The hitters I originally hypothesized about are not in evidence here. Including hitters who have seen between 500 and 1,000 pitches, Jakob Marsee is 100th; Isaac Collins is almost smack-dab in the middle of the pack. In fact, while the Brewers are (or were as of last week) outperforming their overall stats in both of these hitter-friendly areas, their individual hitters rank all over the leaderboard
The Brewers vs. MeatWaste
| Player | Total Pitches | wOBA | MeatWaste% | MW RV/100 | Rank | MWI/100 | Rank |
|---|---|---|---|---|---|---|---|
| Christian Yelich | 2,409 | .350 | 16.6% | 5.25 | 36 | 5.40 | 49 |
| Danny Jansen | 1,261 | .308 | 15.1% | 4.19 | 75 | 4.94 | 70 |
| William Contreras | 2,449 | .336 | 14.9% | 4.92 | 51 | 4.87 | 73 |
| Sal Frelick | 2,168 | .339 | 15.8% | 3.79 | 98 | 3.90 | 125 |
| Jackson Chourio | 1,886 | .341 | 15.9% | 3.68 | 108 | 3.62 | 135 |
| Caleb Durbin | 1,700 | .327 | 16.8% | 2.81 | 162 | 3.09 | 180 |
| Rhys Hoskins | 1,393 | .332 | 15.9% | 2.71 | 168 | 2.80 | 201 |
| Isaac Collins | 1,705 | .348 | 15.1% | 2.72 | 166 | 2.52 | 224 |
| Andrew Vaughn | 1,607 | .308 | 15.9% | 1.57 | 263 | 2.31 | 244 |
| Jake Bauers | 787 | .320 | 16.6% | 0.76 | 313 | 0.92 | 335 |
| Joey Ortiz | 1,763 | .263 | 14.4% | 0.00 | 355 | 0.86 | 337 |
| Blake Perkins | 646 | .283 | 14.1% | 0.00 | 358 | 0.54 | 354 |
| Brice Turang | 2,573 | .345 | 14.9% | 1.04 | 293 | 0.50 | 358 |
Source: Baseball Savant
Out of 406 hitters
It appears that my tepid pessimism about Milwaukee was either misplaced, or not quantifiable through MeatWaste. I’ve now typed that hilariously icky neologism 37 times in the body of this article, and so I think now is a good time to wrap things up. Goodbye.
Content Source: blogs.fangraphs.com