
Aaron Judge stands alone. Well, Aaron Judge usually stands alone. This year, he’s got company. Judge leads all players with 8.3 WAR. Shohei Ohtani is right behind him with 7.8 total WAR (6.5 as a hitter and 1.4 as a pitcher), and Cal Raleigh is right behind him with 7.6. With a difference of less than three-quarters of a win, that’s an extremely tight race to be baseball’s WAR leader. It got me wondering how often these races are that tight, so I hit the spreadsheets. I pulled the top three WAR-getters in each season since 1901 and checked to see whether this year’s race is an outlier, and if so, just how out there it is compared to seasons past. The short answer is yes, this race is really tight by pretty much any historical standard.
Before we get into it, I’ve got to make a couple notes on the data and methodology here. First, I used FanGraphs WAR, both because I work here and because I’m a FanGraphs fan. (I’m also a fan of FanGraphs’ graphs, which makes me FanGraphs graphs fan. I could keep going.) Ohtani leads baseball in WARP, Baseball Prospectus’ version of WAR. As Ginny Searle wrote on Wednesday over at BP, Judge leads Raleigh by much more in both Baseball Reference WAR (which doesn’t incorporate pitch framing) and WARP (because DRC+ thinks Raleigh’s deserved offensive performance is slightly below his actual performance). Still, we’re going with fWAR, or as we refer to it here at FanGraphs, WAR.
Second, no matter which version you use, you’re really not supposed to dice WAR up like this. It’s a great stat that captures a lot, but it has error bars like any stat, and there are probably bits of value players produce that we can’t measure. If you’re selecting an MVP or comparing any two players based on fractions of a win, you’re probably doing it wrong. But I double-checked, and it turns out that nobody’s going to fire me for handling WAR slightly irresponsibly. Today, we’ll have some fun doing it wrong.
Third, I combined both hitting and pitching WAR, but only when it benefitted the player in question. That is, I excluded any partial season with a negative WAR total. Back before the universal DH, we didn’t dock an NL pitcher for their performance at the plate when we assessed their contributions. When we talked about a pitcher’s WAR, we just talked about their pitching WAR; we didn’t ding them because the rules said they had to go up there to bunt and strike out a bunch of times. The same goes for a position player who had to pitch some in garbage time. So we’re only including positive contributions. If you’re a pitcher who hit well or a batter who threw a scoreless garbage time inning, you’ll get some bonus credit by this method, but you won’t get docked for being bad at something that’s barely even part of your job description. If Shohei Ohtani were to put up negative WAR on one side of the ball, that would be a different matter, but this is just what seems fairest to me.
Fourth – sorry, I’m just kidding around. There’s no fourth. Three paragraphs full of notes about the data is plenty. Let’s get to it.
As of last night, the difference between Judge and Raleigh is 0.691464424 WAR. That’s just under one-seventh of a win. If you’re keeping score at home, I hope you’ve got very, very tiny handwriting. This is a really tight race. In terms of seasons with the smallest gap between the first- and third-place WAR-getters, it ranks 30th since 1901. We’re in the 77th percentile. The average difference is 1.73 WAR, and the average standard deviation is 0.92 WAR. We’re not in outlier territory, but we’re definitely on the smaller side of the ledger:
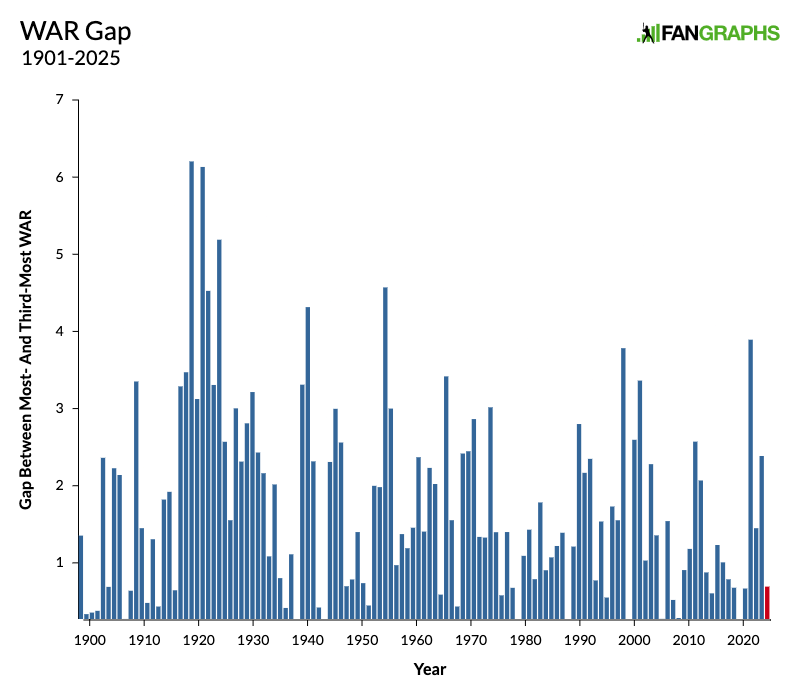
The outlier seasons belong to Babe Ruth, whose discovery of the home run in a fortuitous laboratory accident allowed him to lead the league in WAR 10 times in 13 years starting in 1919. In those 10 years, he twice led the third-place finisher by more than 6.0 WAR, and his average lead was 3.81. The three times that Ruth didn’t lead, Rogers Hornsby overtook him, and Hornsby’s average lead was 3.14 WAR. It was a different time. But even if we ignore Ruth and Hornsby and start in 1932, the average only drops to 1.56. That’s still more than twice as big as this season’s gap. By any historical standard, this is a very close race. Here’s the 10-year rolling average:
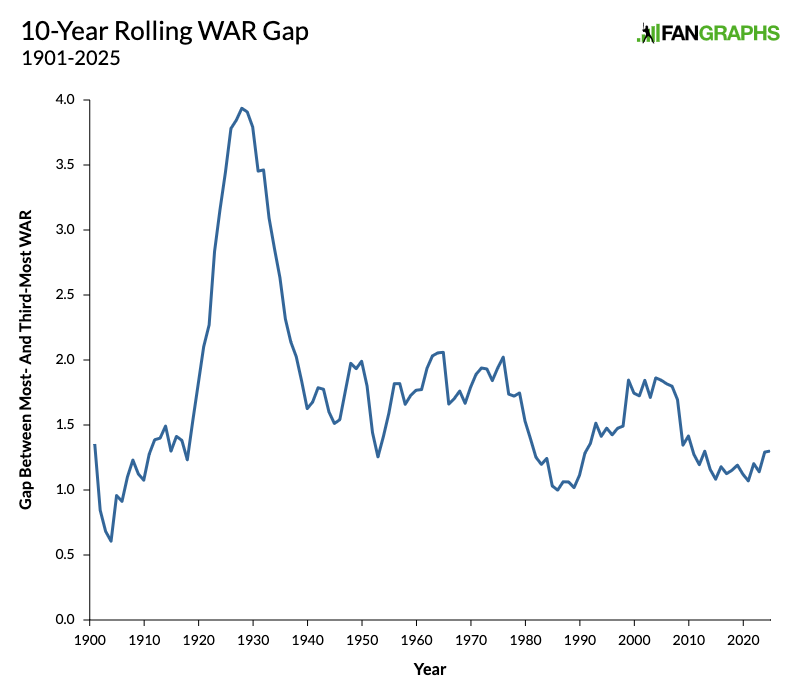
Once you get out of Ruth’s shadow, I don’t really know how to interpret this graph other than to say that there have been some ups and downs. Generally speaking, we’ve been in a trough for the past 15 years or so. However, you might notice that the numbers tick up at the very end there. That’s because of Judge. Not only is this year’s gap particularly low, it’s low for Judge in particular. He’s on pace to lead the league in WAR for the third time in four years and the fourth time in nine years. He’s one of just eight players in baseball history to lead the league four times, and his average margin over the third-place finisher is 2.0 WAR. He led by 3.9 WAR in his historic 2022 season and by 2.4 in 2024. Until this season’s close call, his average was 2.4 WAR. That’s up there with the very highest averages in the history of the game. In his WAR leader seasons, Judge has led the third-place finisher by a total of 8.0 WAR. That’s the seventh-highest total ever, between Hornsby and Honus Wagner.
In other words, this is yet another way to appreciate the fact that Judge has dominated the game of baseball like few others before him. Here is the top 10 all-time. The average lead (for players who led the league in WAR at least twice) is on the left, and total lead is on the right. The company is pretty good:
Largest Average and Total WAR Gaps
In order for two players to get close to Judge, we needed to have Ohtani playing the game like no one before him ever has and to have Raleigh challenging for the best catcher season in history. We’ve also got to have Judge dealing with a flexor strain that cost him an IL stint, and that is still costing him WAR by way of limiting his ability to throw and forcing him to DH at times.
Before we wrap up, I have to acknowledge that this article would’ve looked a whole lot different if it had run yesterday. Here’s how the conclusion started in yesterday’s draft:
There’s no guarantee that things will stay this close. These numbers will have already changed by the time this article runs. Judge could launch three homers and push the lead up by more. Regardless, these three players have been this close for a while, and October is getting awfully big in the window. This really is notable.
Well, Judge hit a measly two homers last night. Before he did, the difference between him and Raleigh was just 0.364966393 WAR, the 12th-lowest of all-time. That’s the 91st percentile. This really is a fluid situation. In one day, it can go from historical outlier to “it really is notable, I swear.” If Judge ends on the kind of hot streak that only he can put up, this whole article will be moot. If Raleigh rekindles the magic of the first several months of the season, we could end up back in outlier territory. Regardless, the WAR leader race has been tight all season, and it’s another fun thing to watch for down the stretch.
Content Source: blogs.fangraphs.com